Supplementary Projects
Polar Puzzles
Maps and photographs help connect people visually to remote locations that are undergoing impacts from a changing climate. Puzzles offer a kinesthetic way to interact with and learn about scientific data. The PoLAR Partnership combined these engaging learning tools and developed a series of puzzle-based activities that highlight the rapid changes taking place in the Arctic, Alaska, and Antarctica. The puzzle activities can be used (1) in classrooms with groups or teams of students completing a puzzle and sharing what they learned with the rest of the class, or (2) in informal education settings as a facilitated experience to explore polar climate change.<
Below, you will find the information and materials needed to create your own set of polar puzzle activities. Using maps, data visualizations, and photographs from the Arctic, Alaska, and Antarctica, these activities match a physical puzzle with supporting imagery to tell a story about our changing climate. For each activity you will find an image labeled “puzzle” which you can download and use to order a 20 x 28 inch, 48+ piece puzzle from a variety of online custom puzzle shops. Three of the puzzles (Antarctica, Plateau Glacier, and Pedersen Glaceir) are paired with a supporting image or set of maps that can be used as underlays on which to build the puzzle. These underlays are the same location but show different times or features, and should be printed at the same dimension as the corresponding puzzle (20 x 28 inches). The fourth puzzle (Arctic Ocean) has overlay pieces representing changing sea ice.
Antarctica
The puzzle is a MODIS Satellite image of the ice covering Antarctica. The accompanying set of underlays include:
- a bed topography map of Antarctica, showing the rock surface beneath the ice sheet, with sections of the land that have been pushed below sea level by the weight of the ice
- an ice velocity map, showing how ice flows across the continent and towards the ocean, with some areas moving more quickly than others
- a geographic map, showing the location of scientific stations and other physical featues
- an ice mass loss image, showing where we are losing ice from melt, calving, and/or sublimation, with some areas losing mass more rapidly than others
- a map of subglacial lakes, showing locations of lakes that are formed by geothermal heat from the interior of the earth
- an ice elevation map, showing the amount of ice mounded on West and East Antarctica
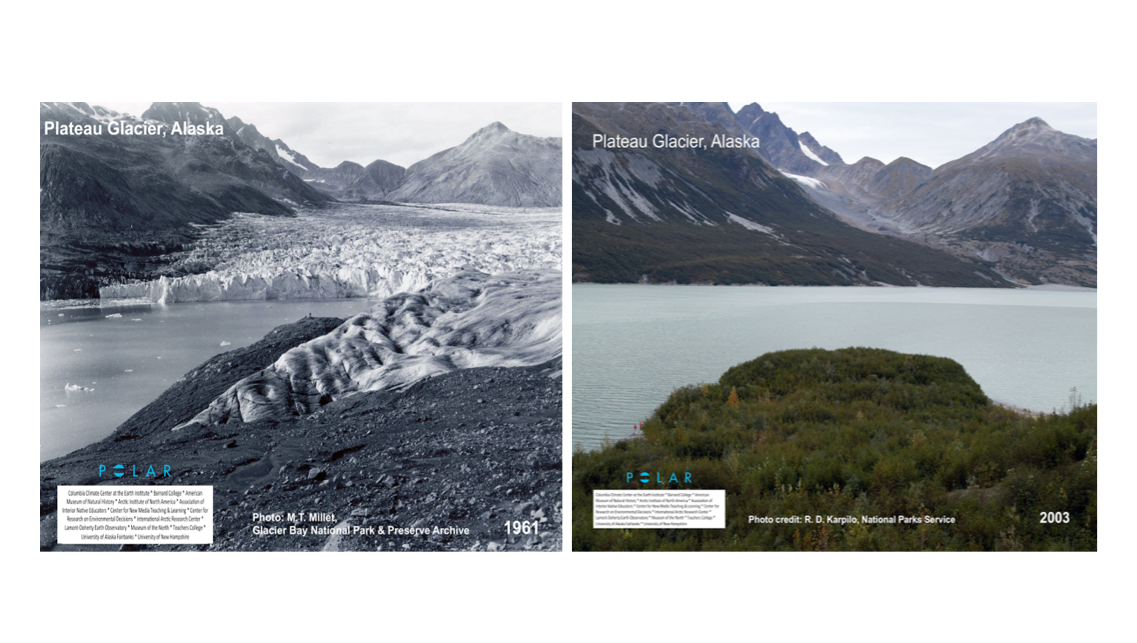
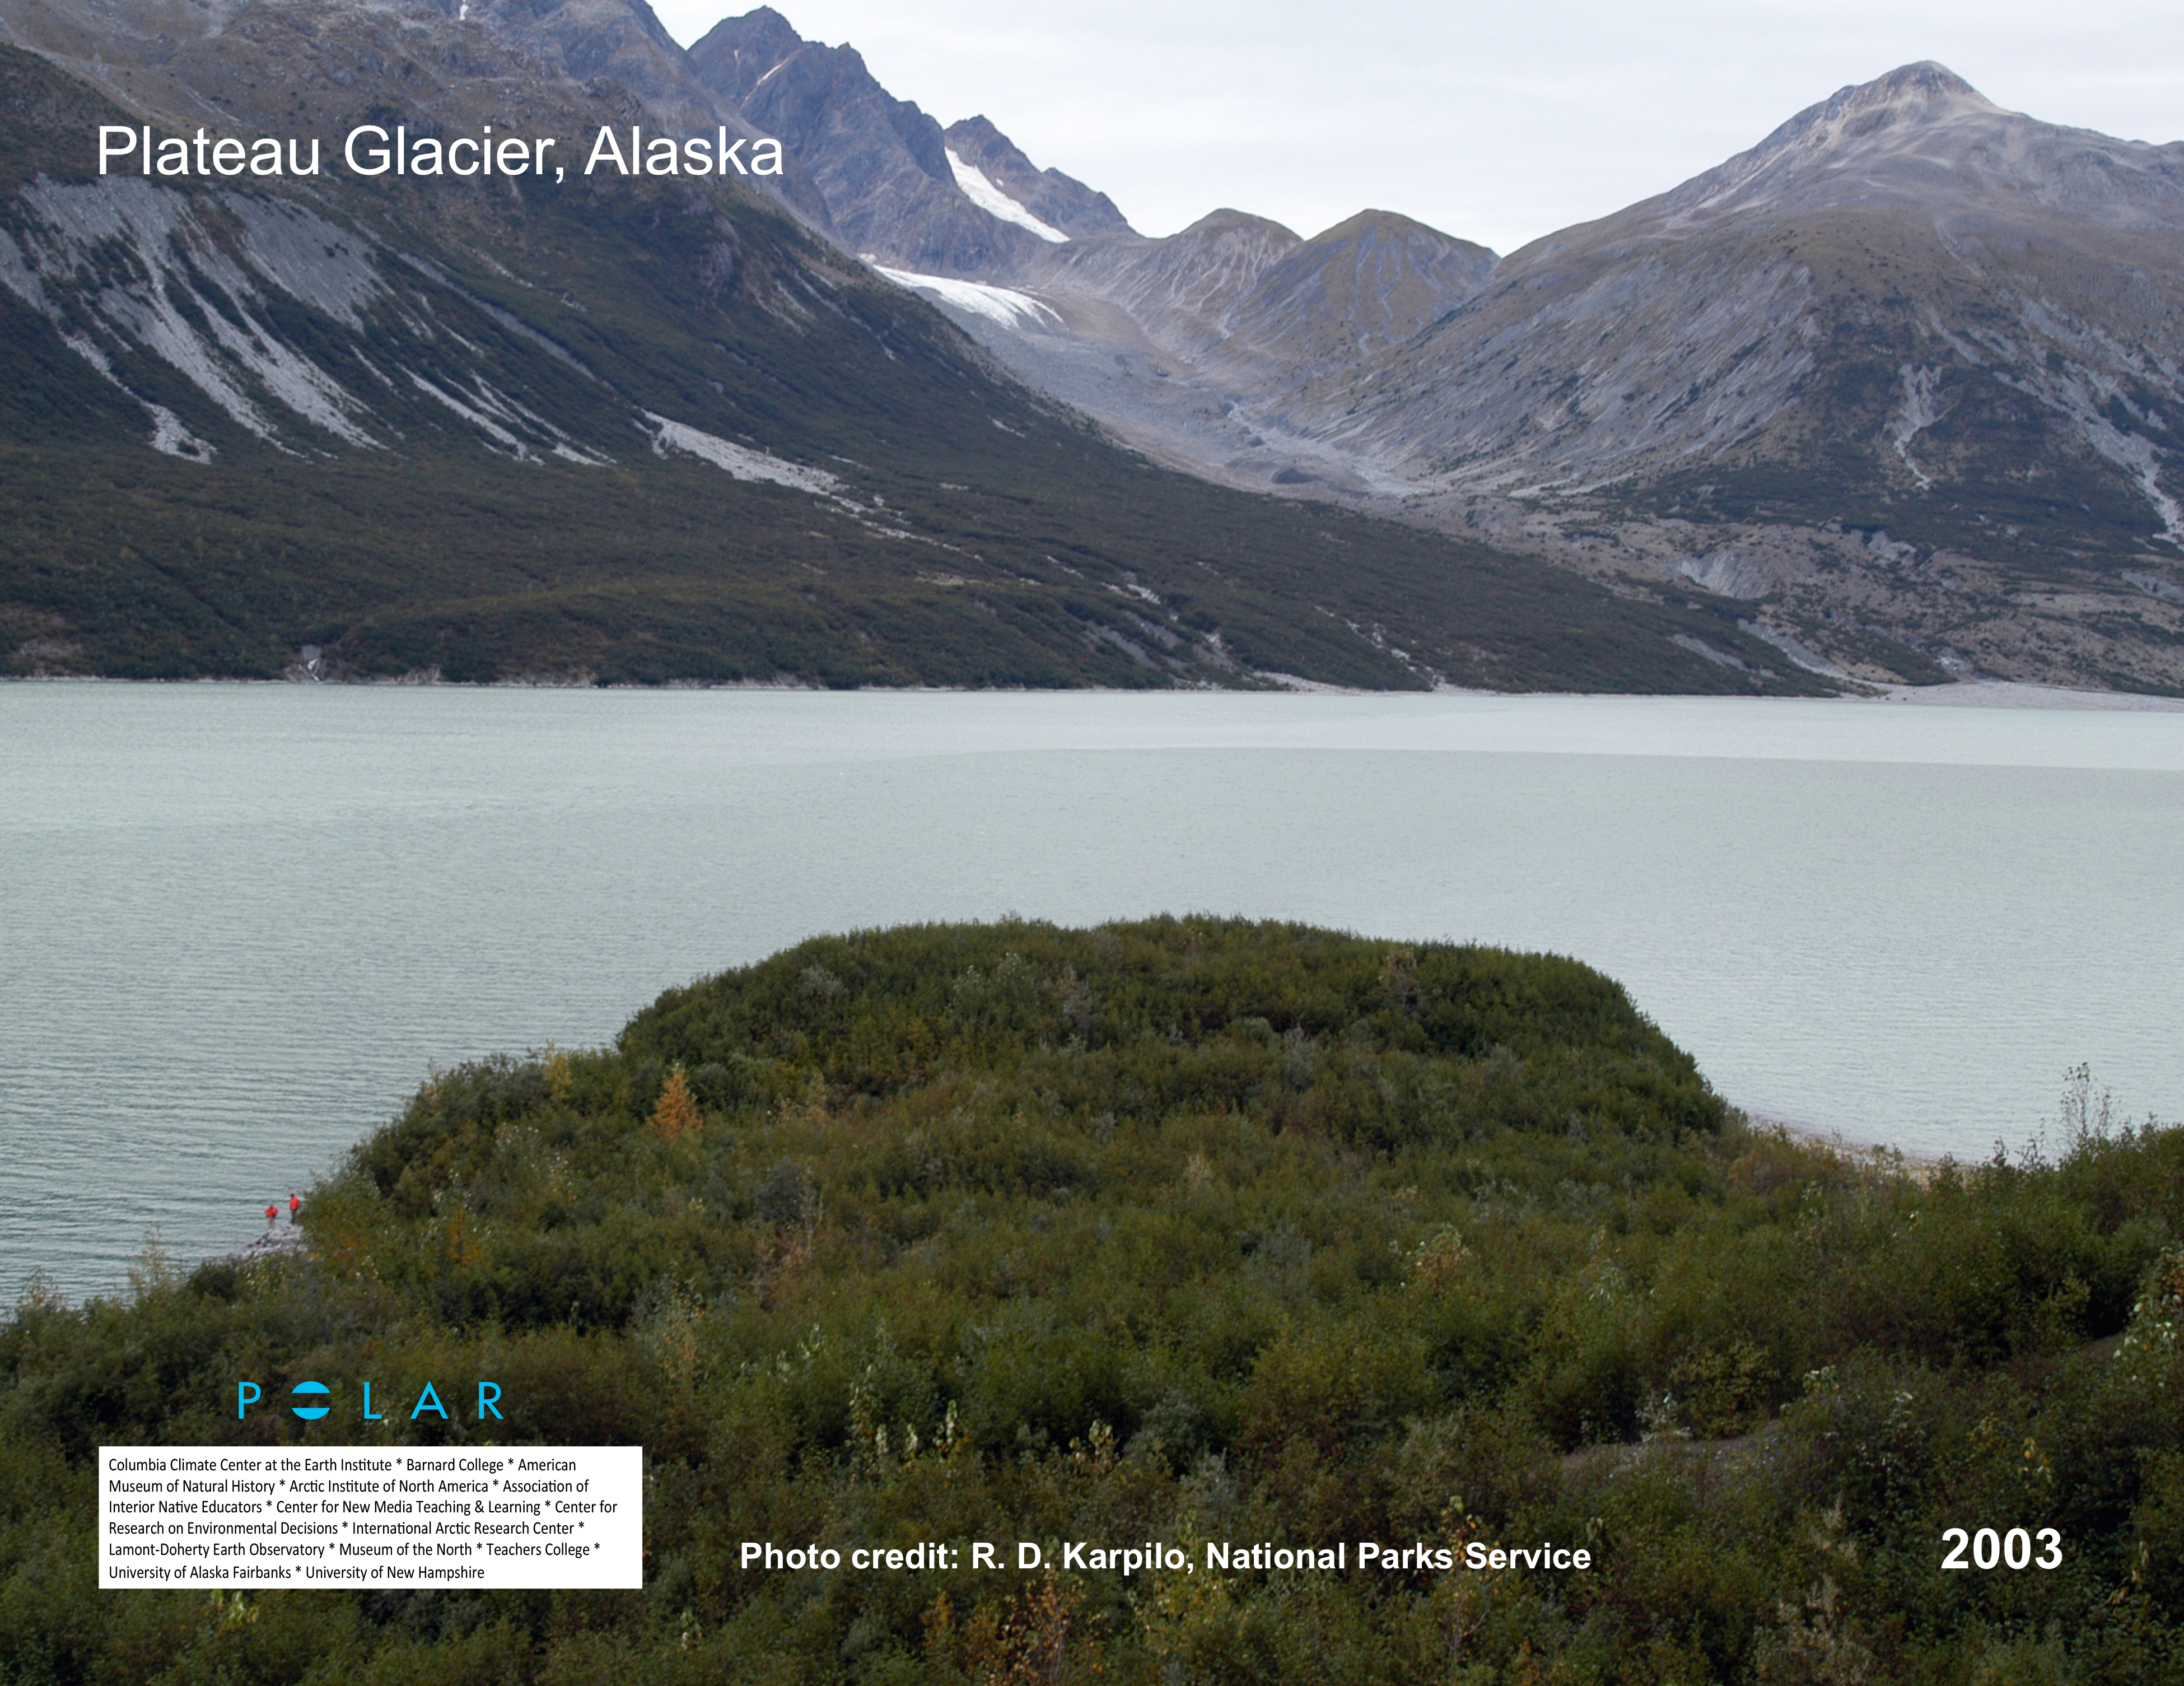
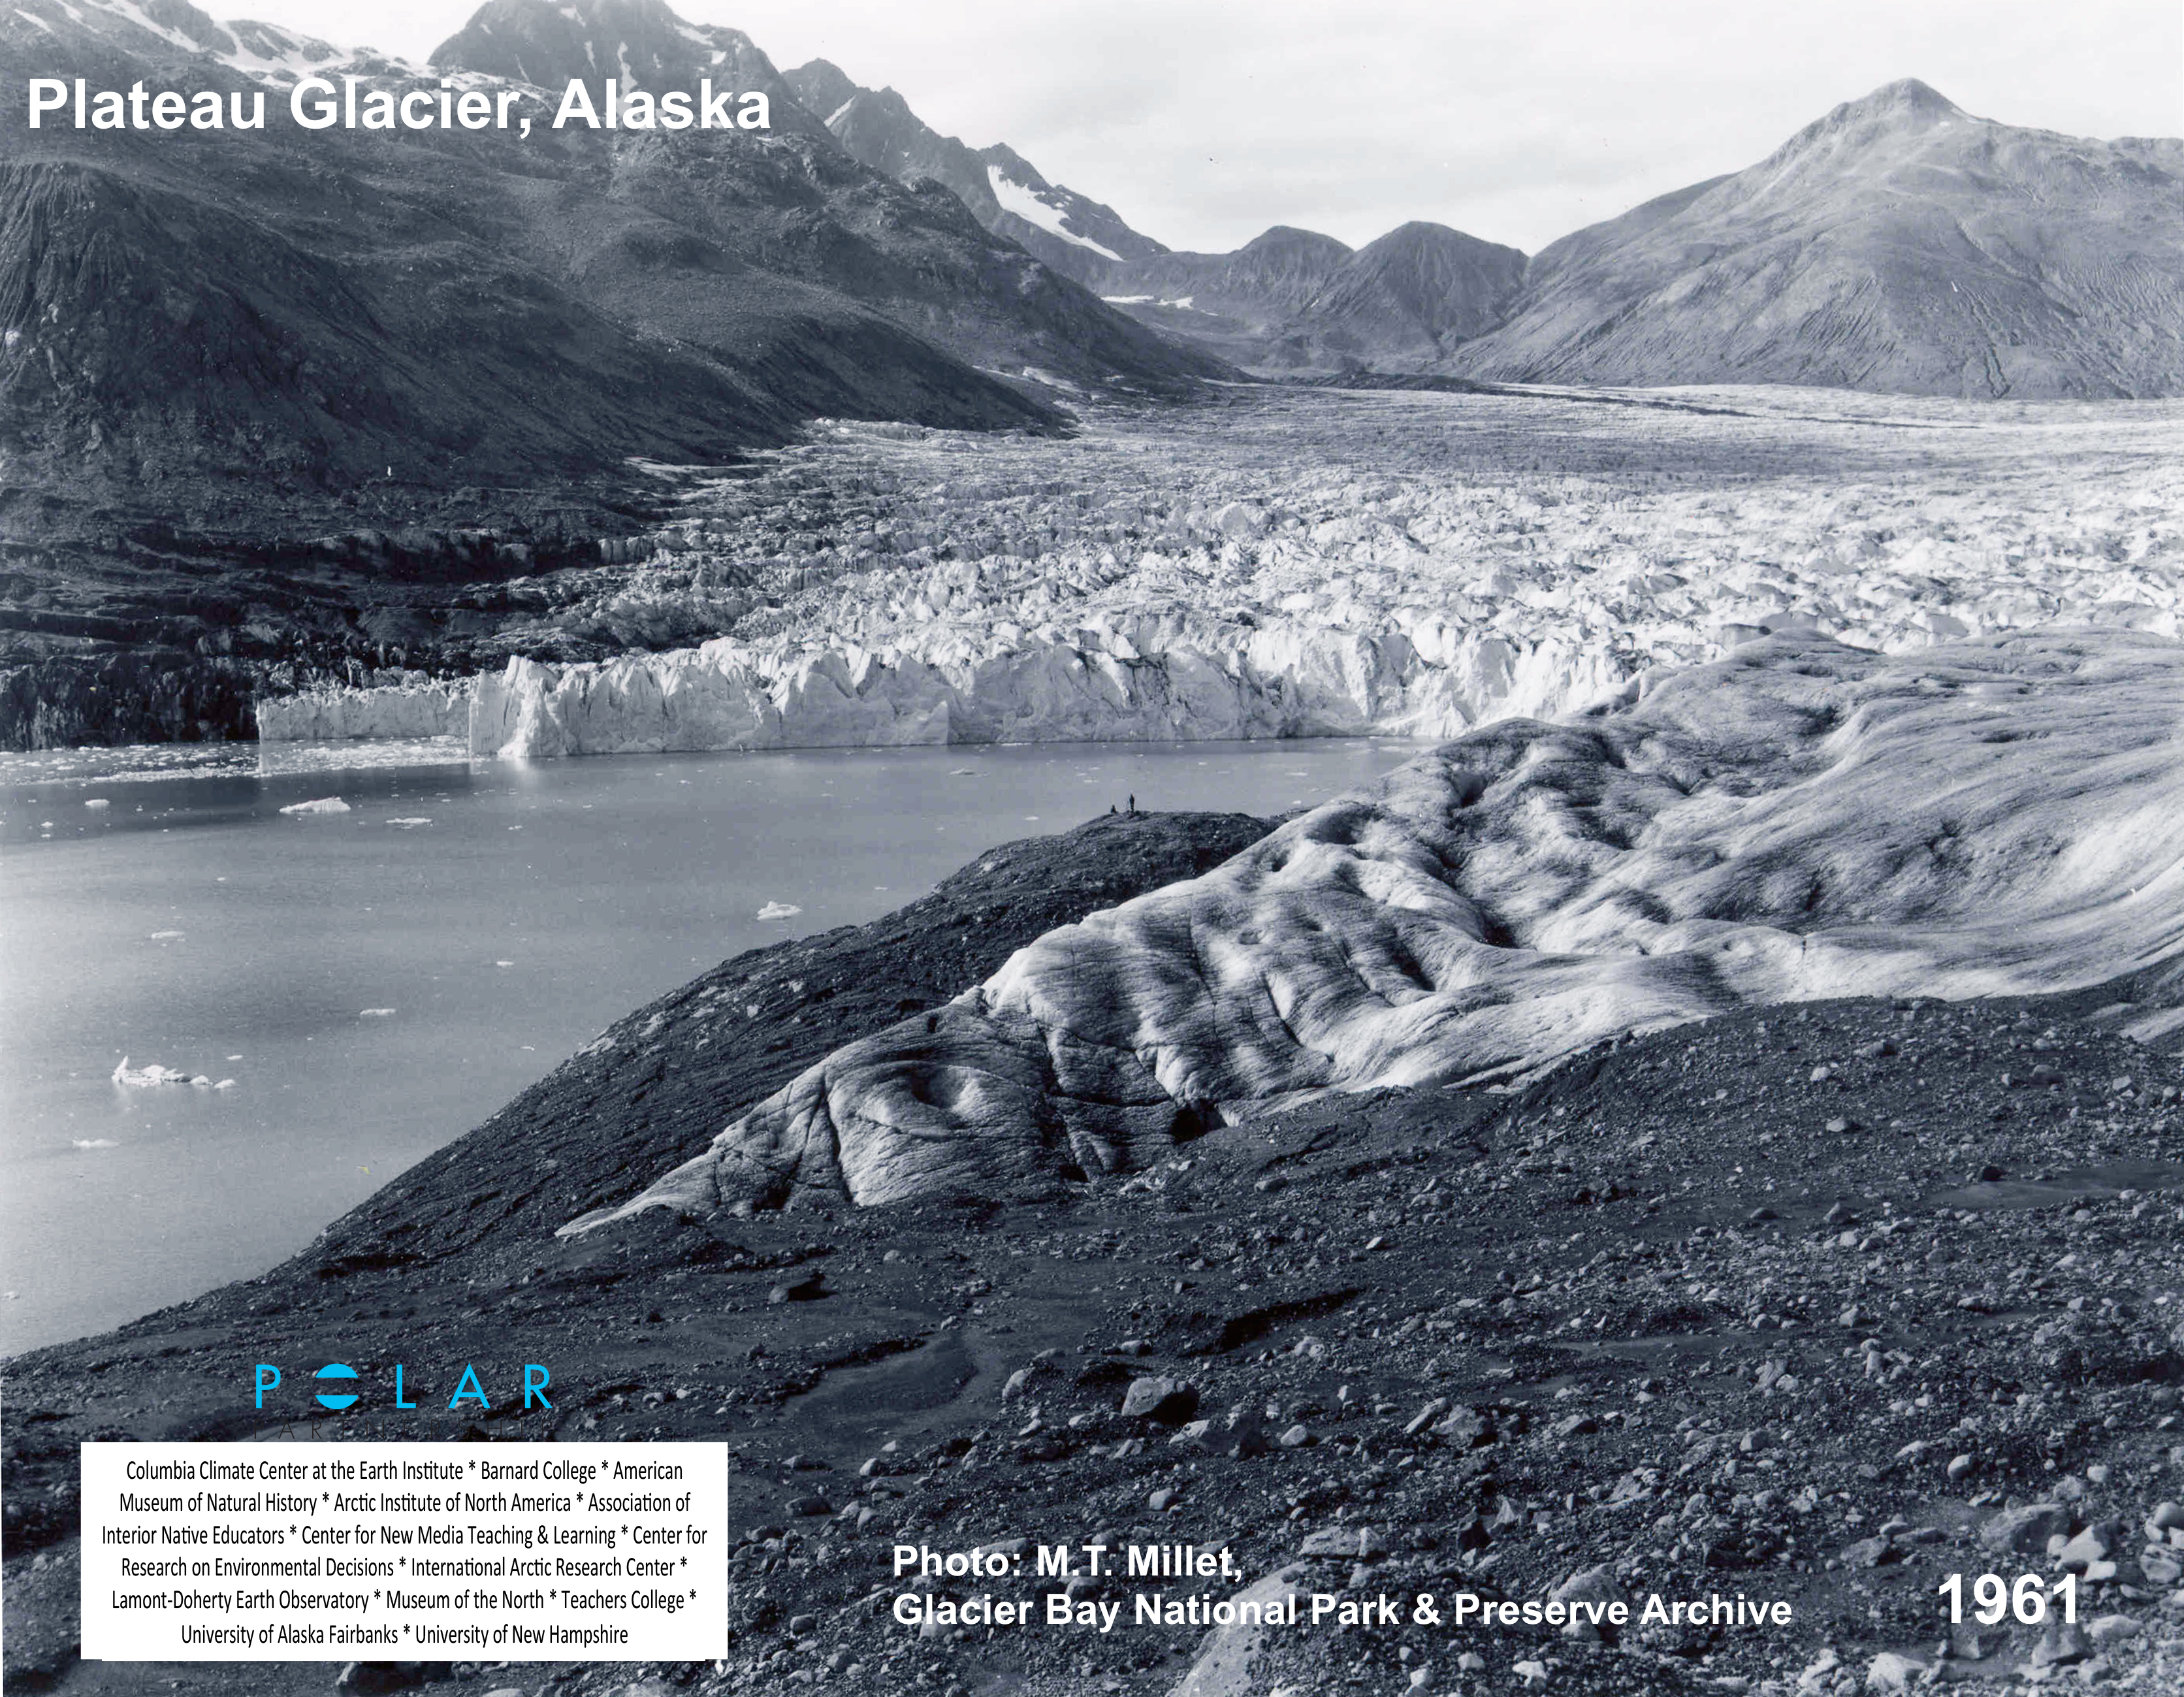
Plateau Glacier, Alaska
The puzzle is a photograph of the Plateau Glacier in 2003. The underlay is a photograph of the same glacier from the same perspective in 1961. Over this 42 year period, the ice has all but disappeared. For scale, there are two people standing on the peninsula in both images.
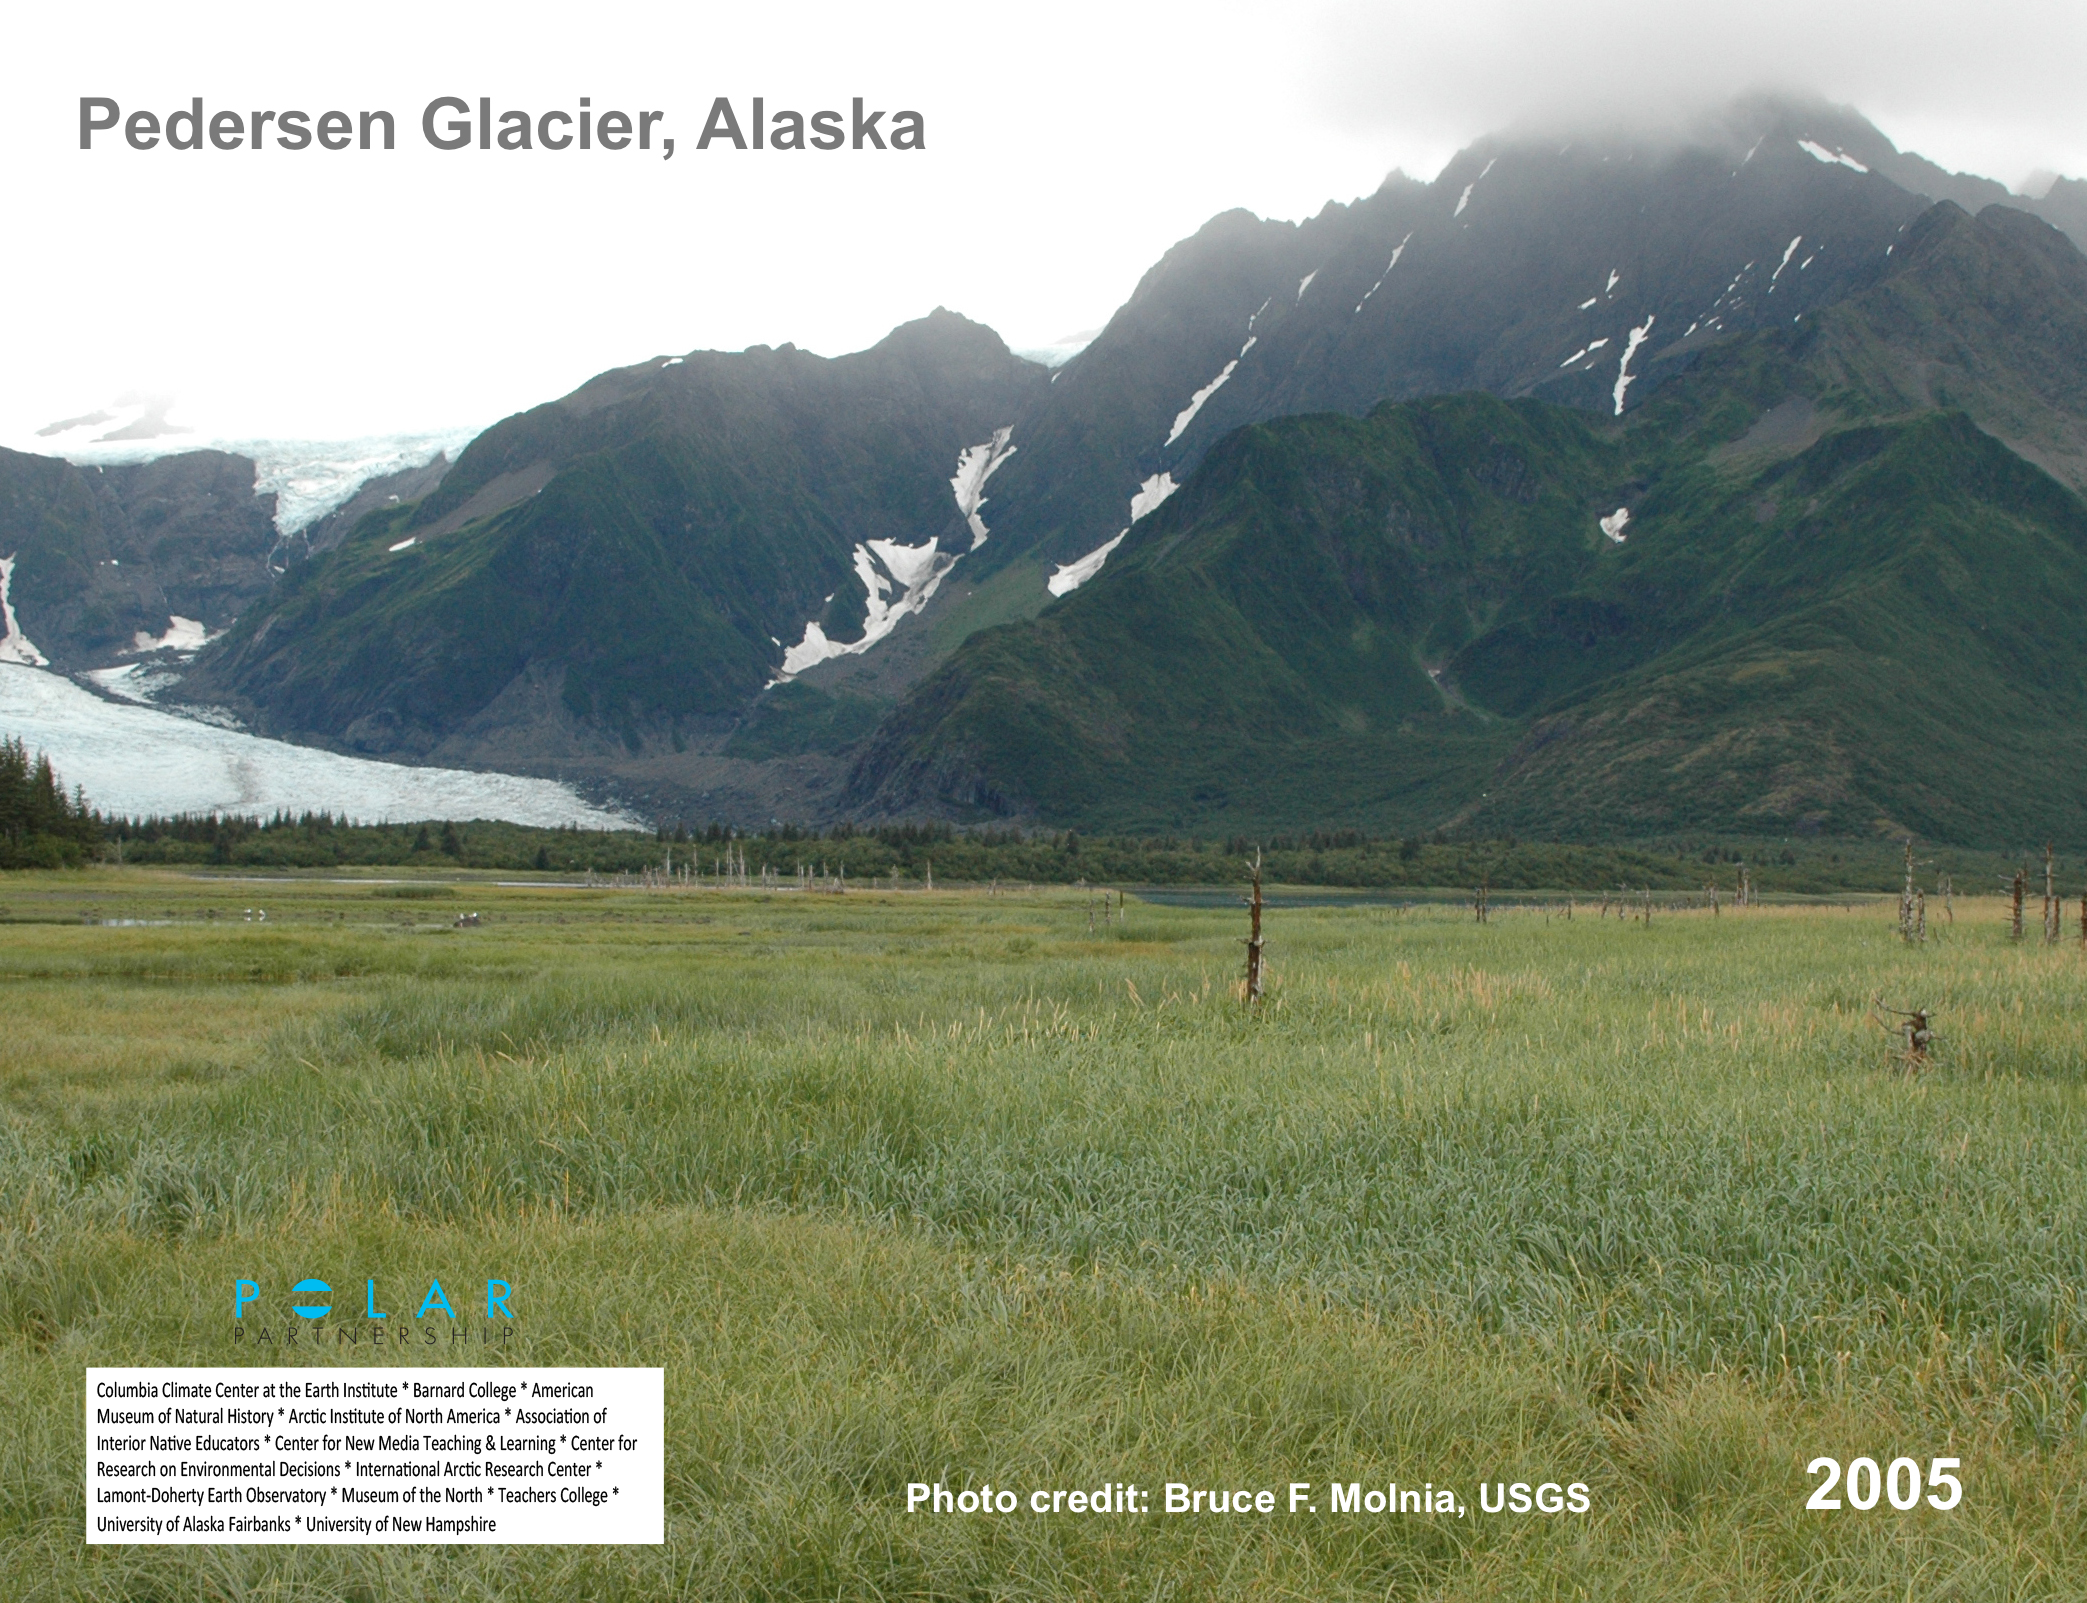
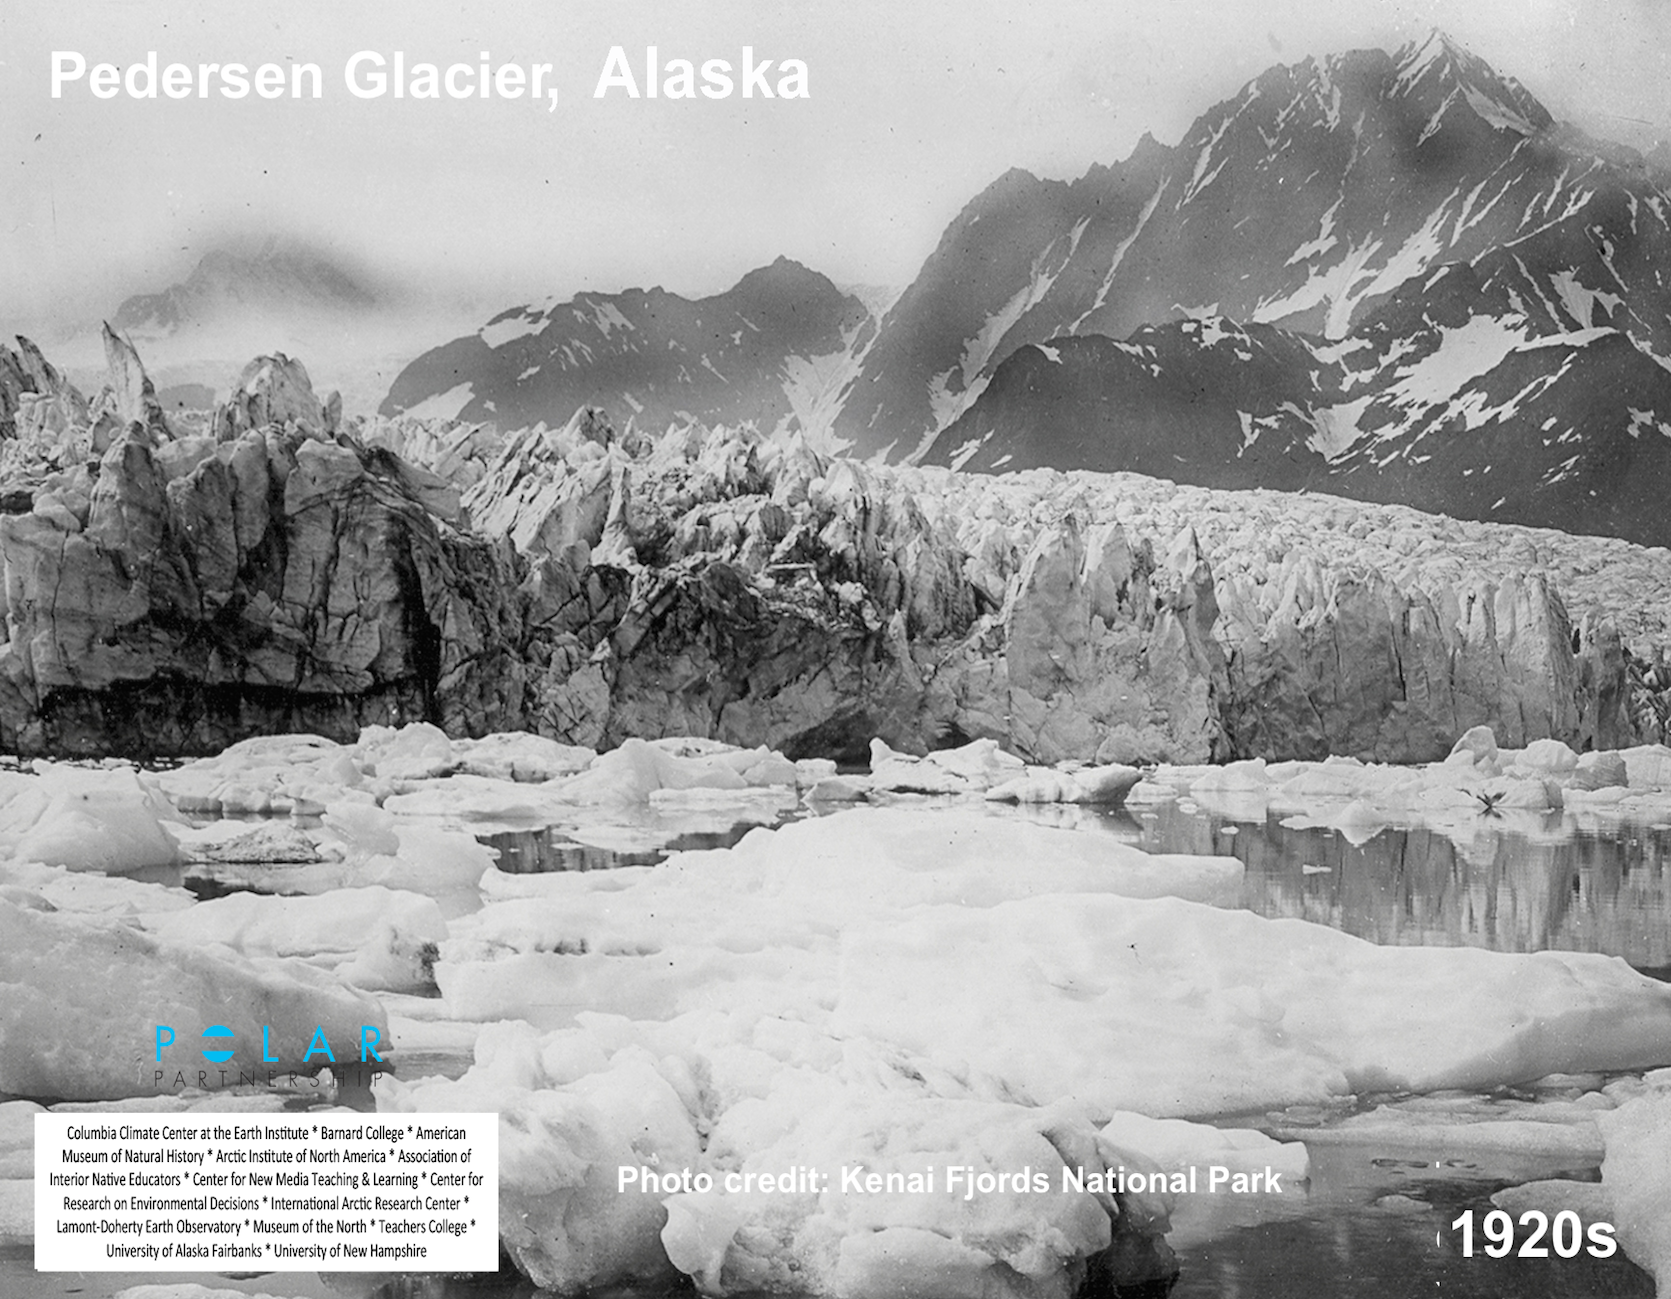
Pedersen Glacier, Alaska
The puzzle is a photograph of the Pedersen Glacier in 2005. The underlay is a photograph of the same glacier from the same perspective in the 1920s. Over this ~80 year period, the glacier has effectively disappeared.
Arctic Ocean
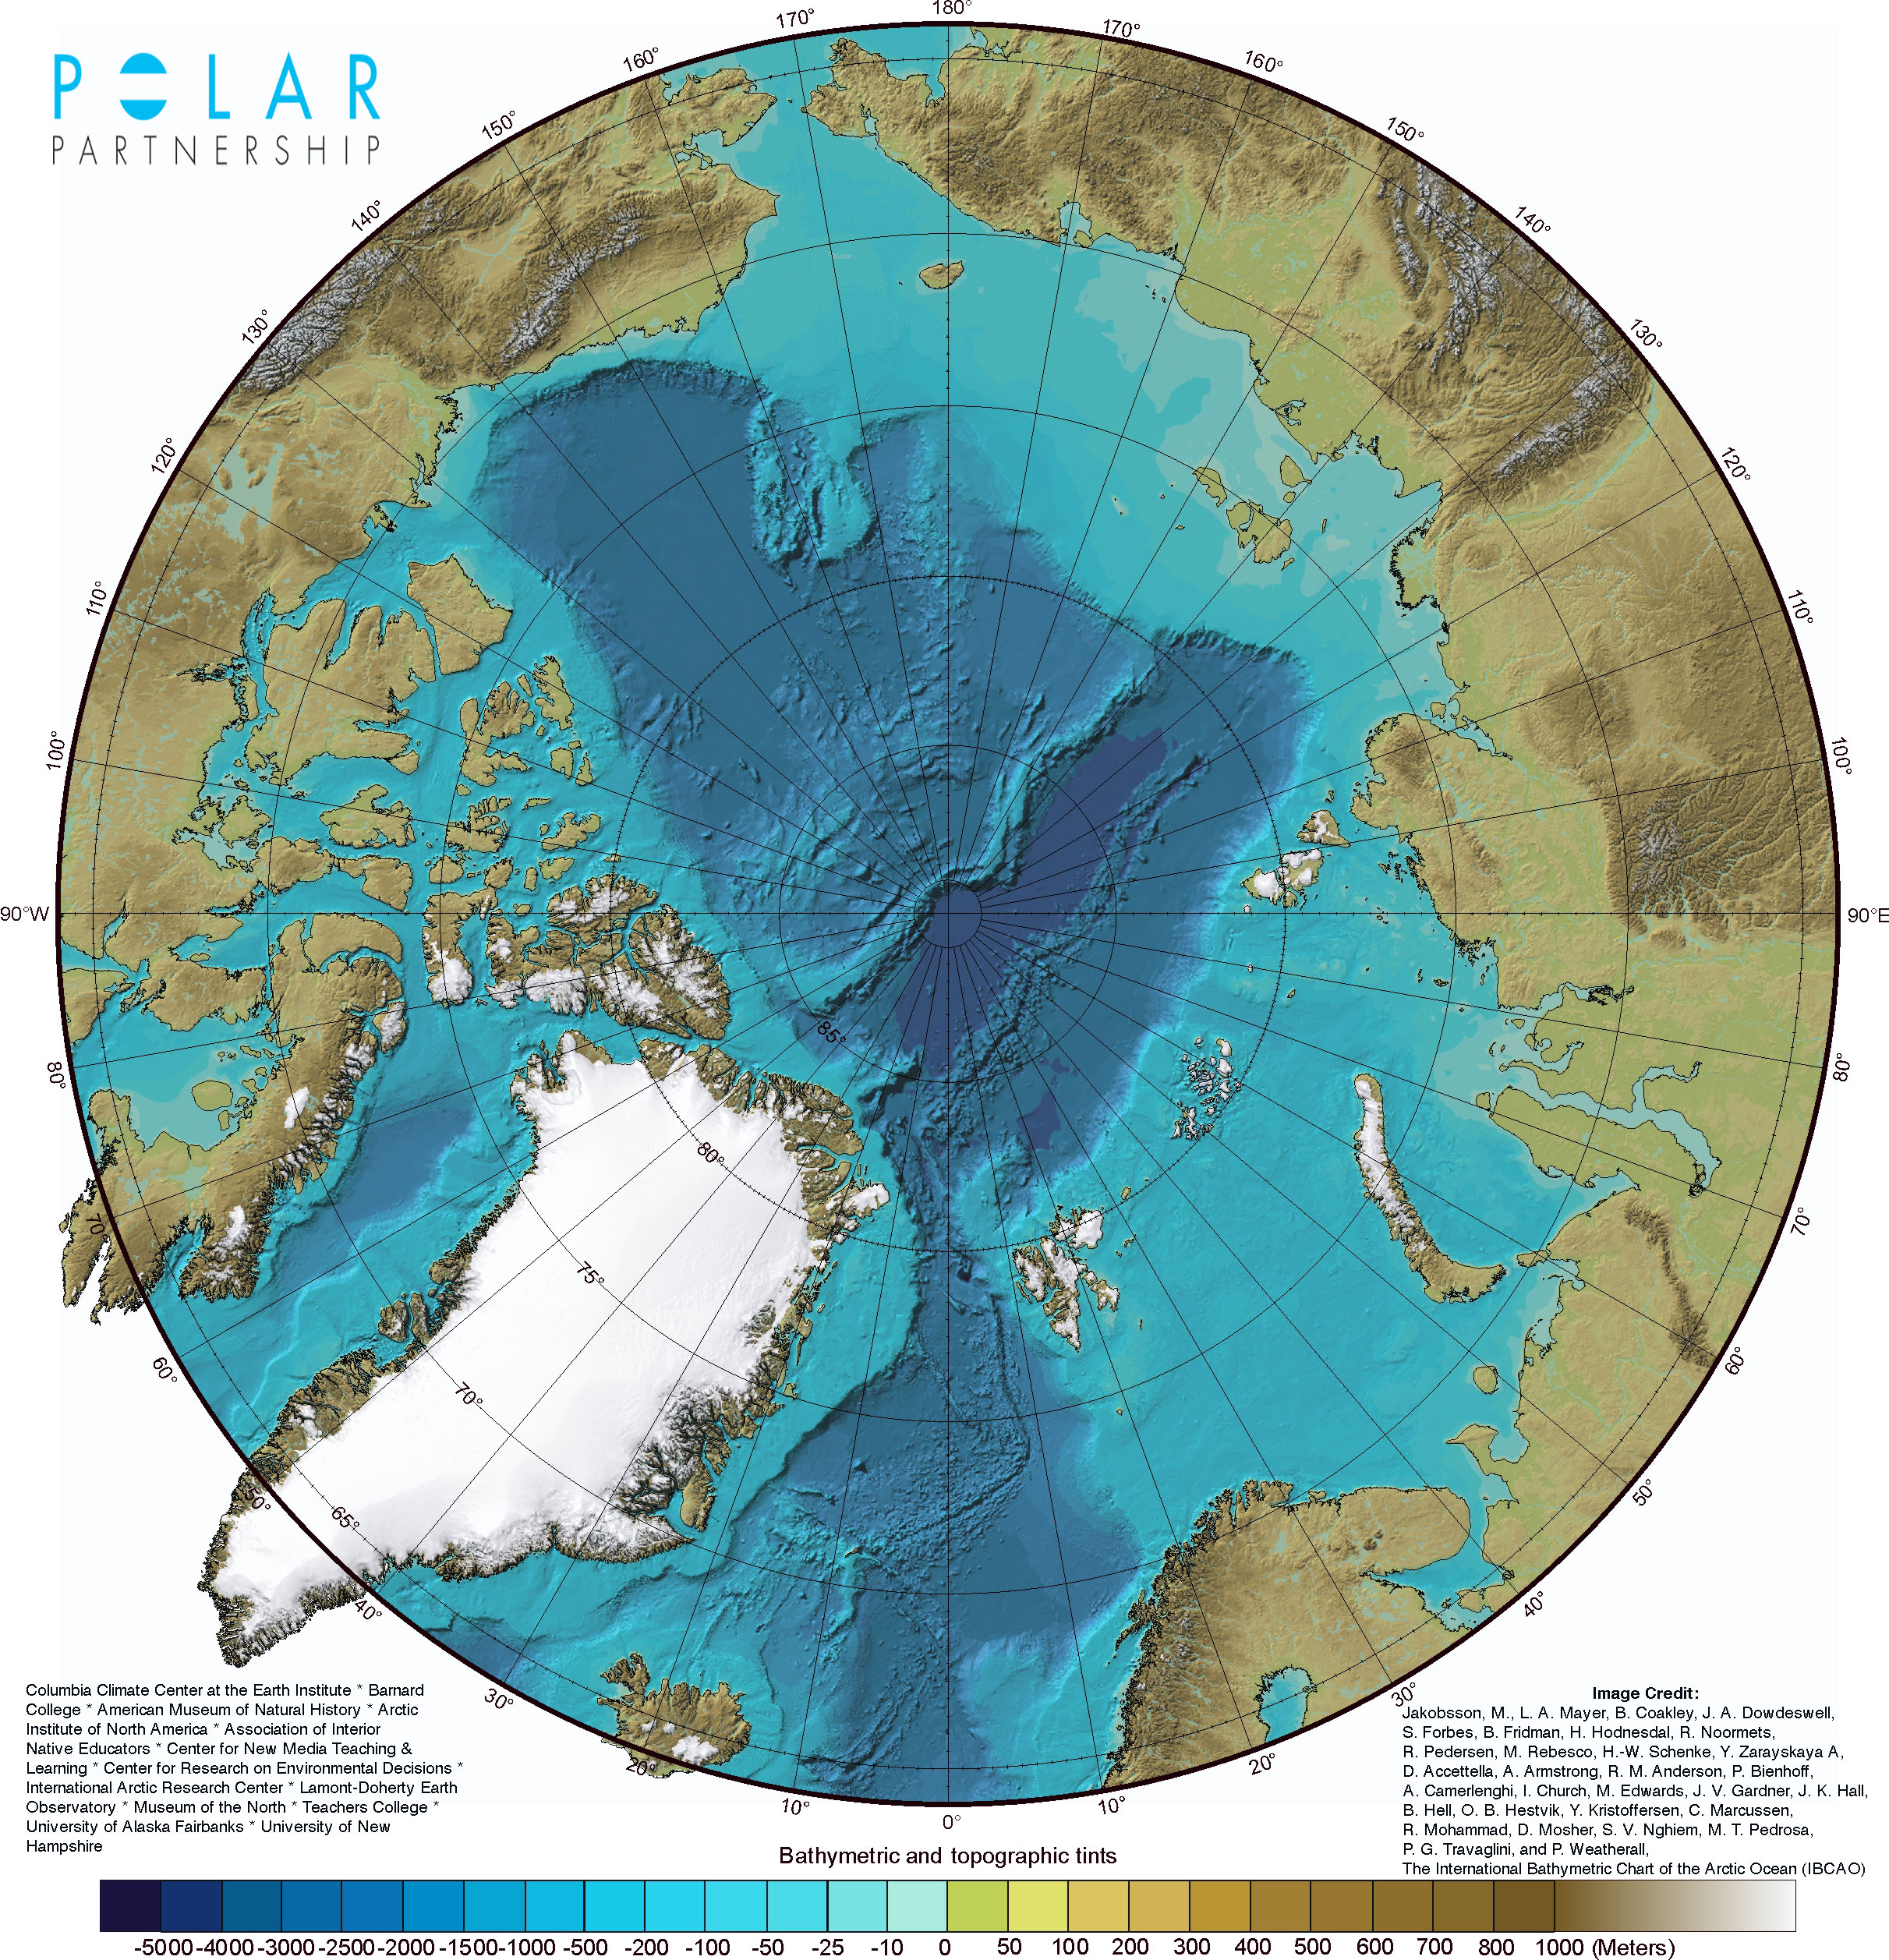
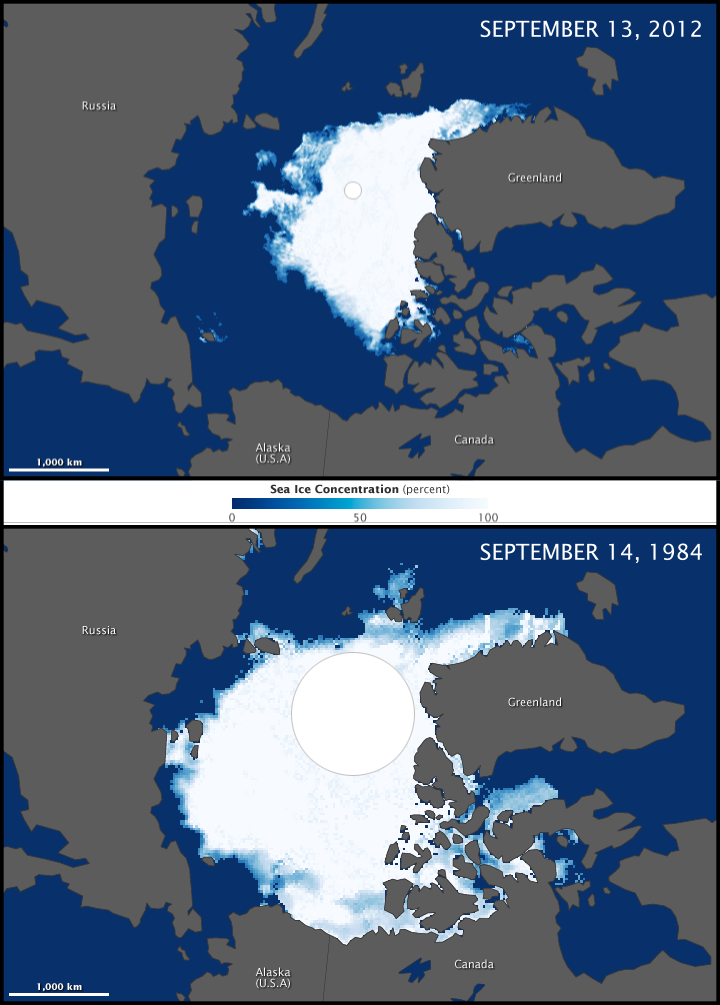
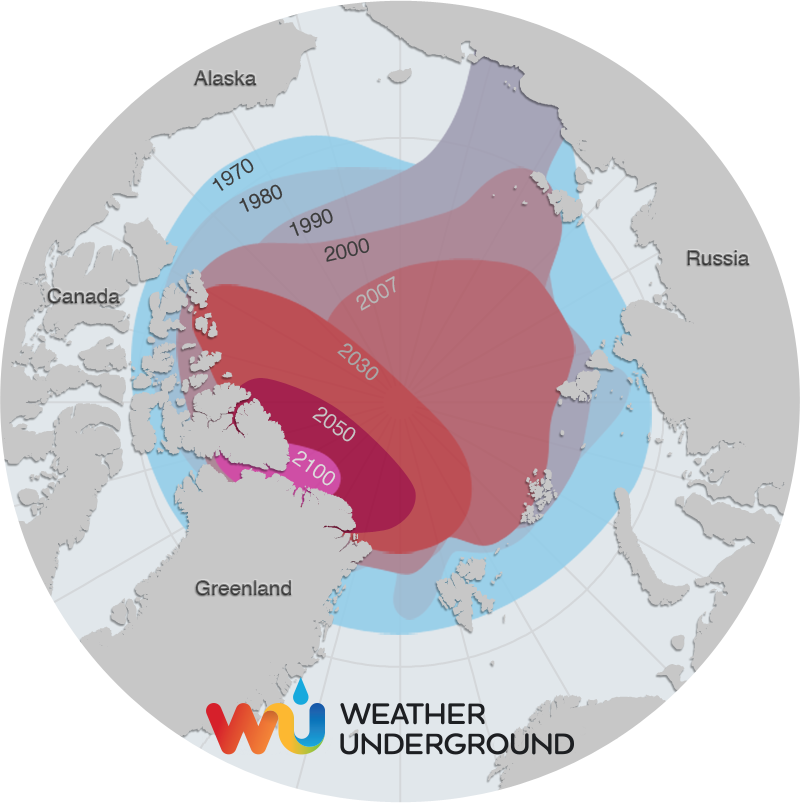
The puzzle is the International Bathymetric Chart of the Arctic Ocean basin. Without the sea ice that normally covers the Arctic Ocean, people might find it unrecognizable. There are three accompanying overlay images of the summertime minimum extent of Arctic sea ice. The first two show sea ice extent from the summers of 1984 and 2012 based on satellite data. The third image features a projection for summer sea ice extent in 2050 based on climate models. We suggest printing these images at the same scale as the puzzle and then cutting out just the sea ice sections and placing them on top of the completed puzzle. You can use the printed piece directly, but we suggest either laminating it or tracing it onto pieces of white foam for use. There is a suggested script for this puzzle activity as well.
Explore Changing Arctic Sea Ice
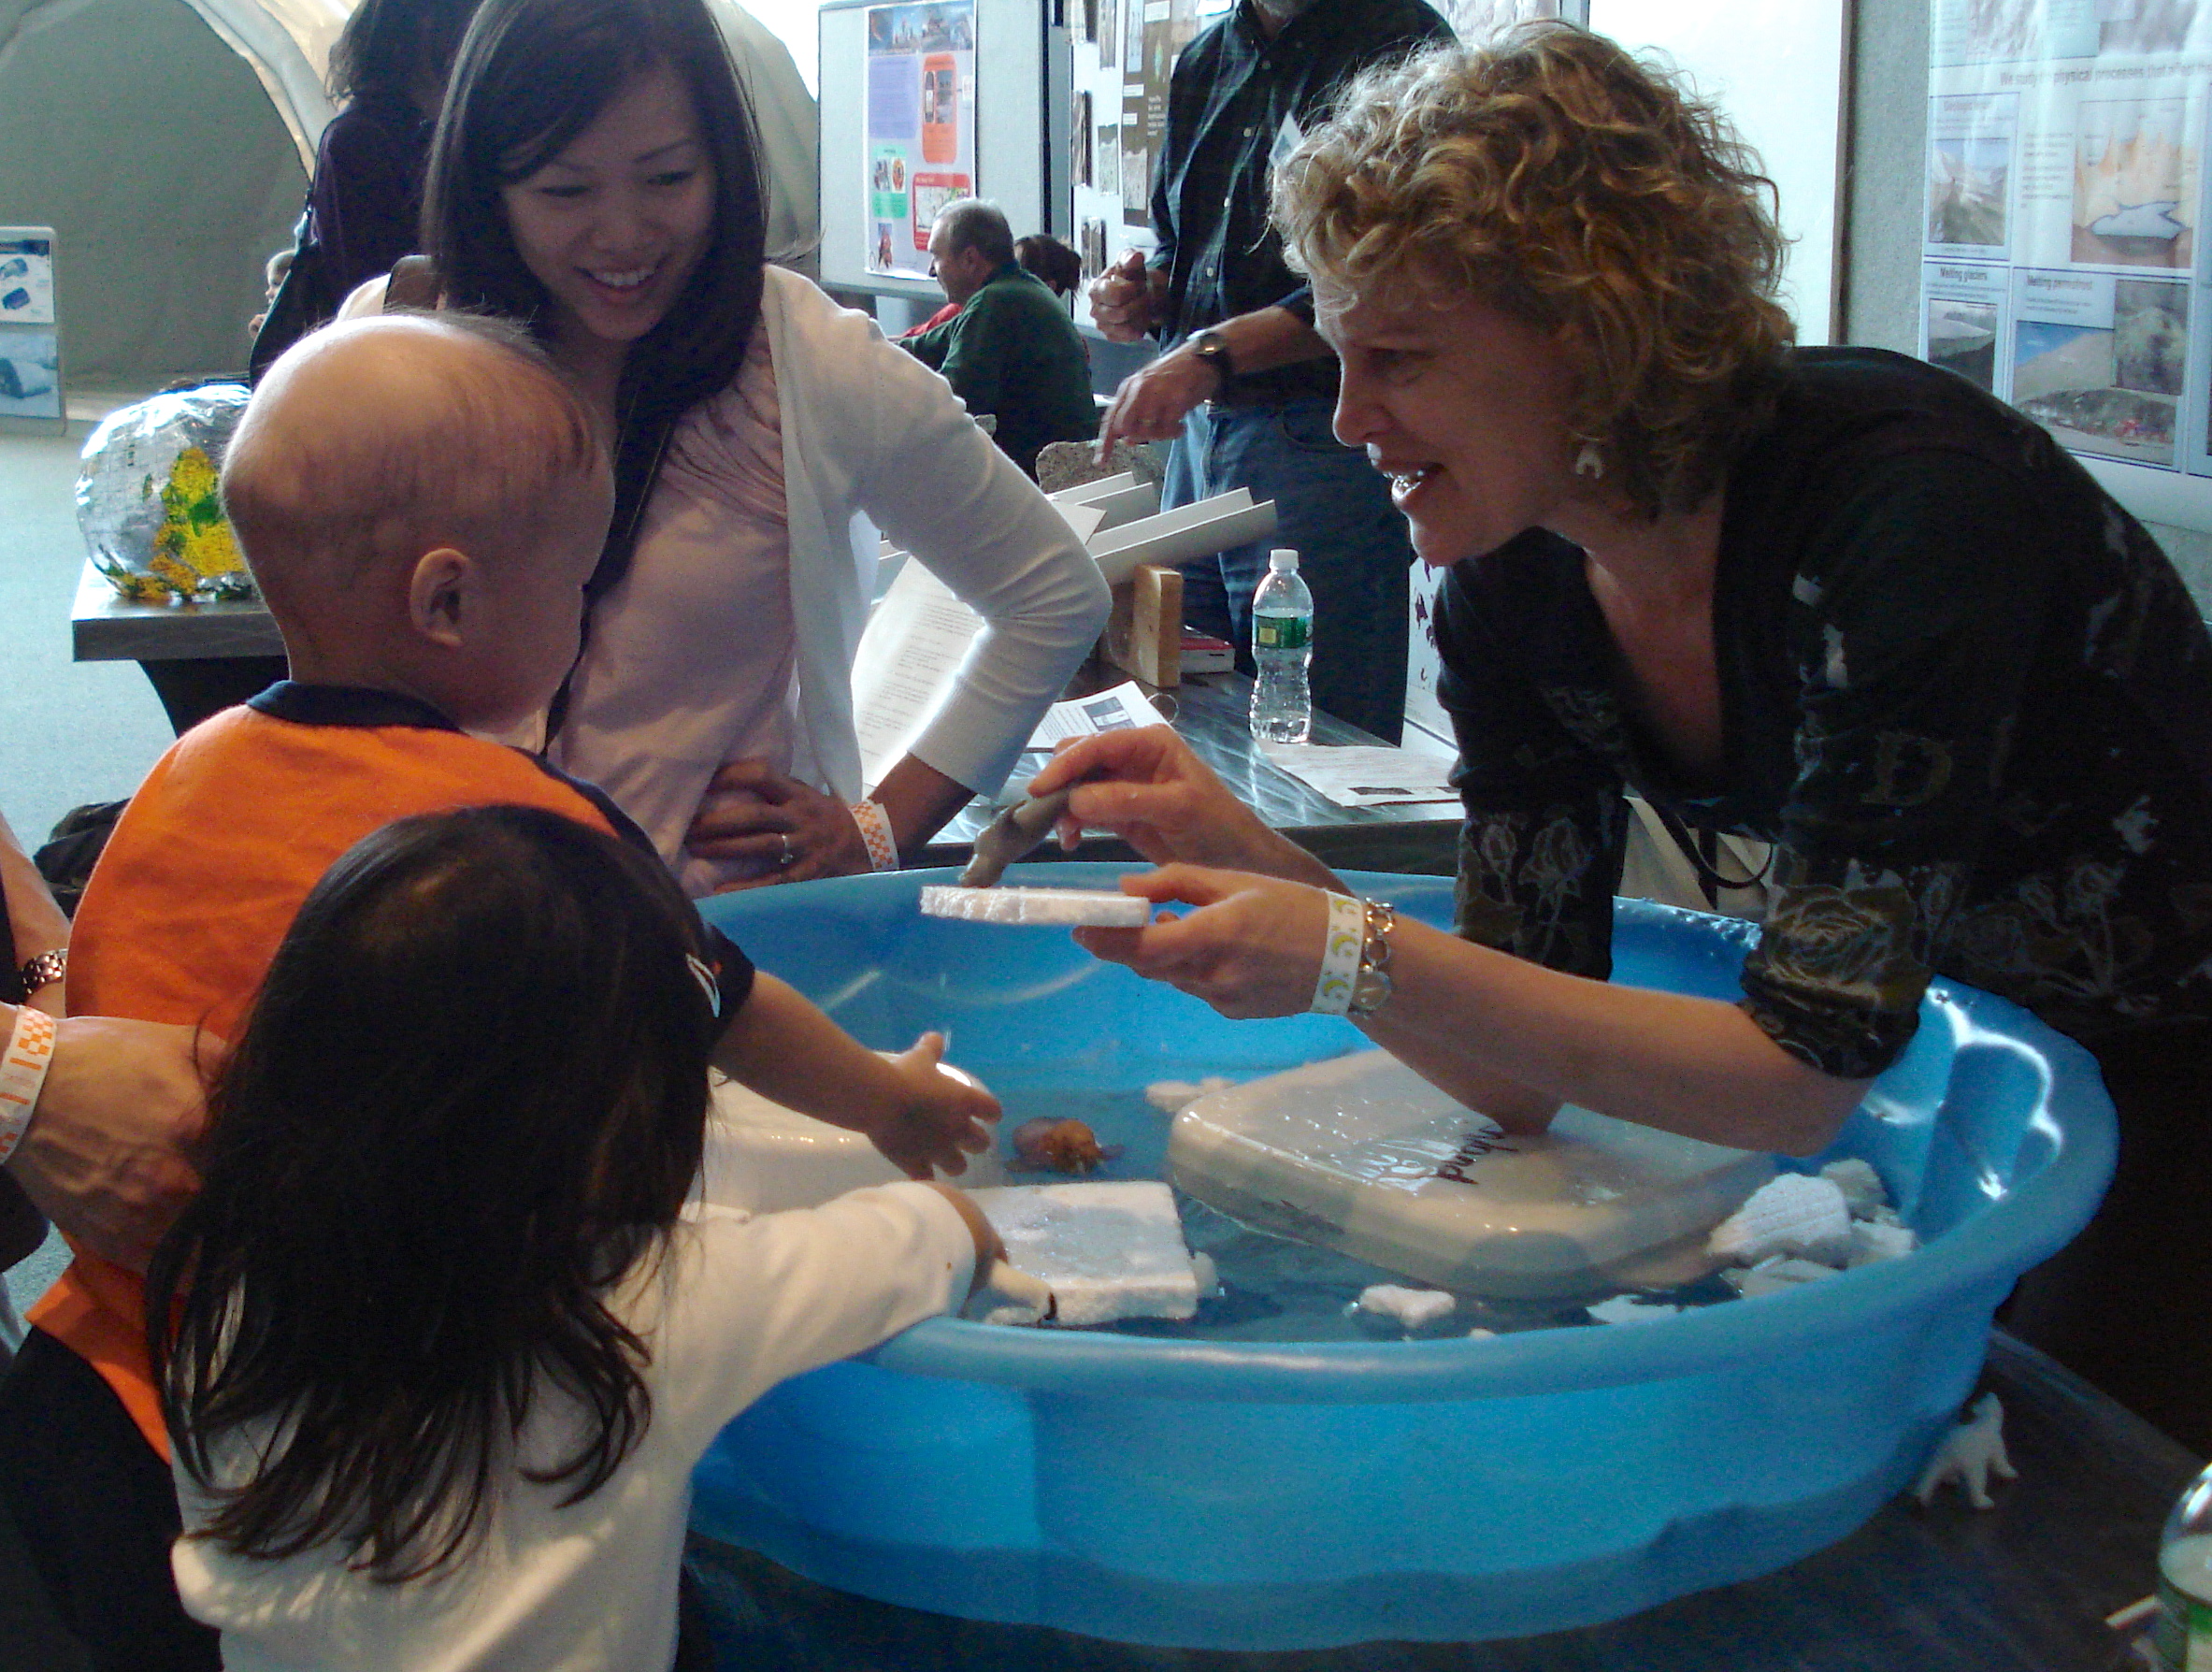
An activity developed by the PoLAR Partnership’s Principal Investigator, Stephanie Pfirman, provides learners with a hands-on opportunity to explore how Arctic sea ice is shrinking and what it means for species like polar bears and walrus. Recently updated to include new data, a description of the activity, including background information, a facilitator script and accompanying poster, is available for use in classrooms and at public events via the Lamont-Doherty Earth Observatory’s Polar Weekend Science Activities page.