Public Polling
Below are publications and presentations produced by the PoLAR Partners.
Polar Polling, Part One
by Larry Hamilton
What do most people know, and what do they believe, about Earth’s polar regions? Who knows and believes what? This post marks the beginning of the Polar Polling series, a regular feature on the PoLAR Hub that explores survey research on public perceptions.
Polar perceptions among people far from the poles began to intrigue me years ago, as I was doing research on society and environment in the Arctic. Arctic environments are changing, of course, driven partly by things happening far away. So the activities and perceptions of people in distant societies can affect people and ecosystems in the Arctic.
Random-sample surveys provide a window on what the general public knows and believes. In Polar Polling we will look at examples where surveys have been applied to polar topics, much as they usually are to politics or current events. Our first example, the General Social Survey (GSS) has been interviewing representative samples of the U.S. public about many different subjects since 1972. Their 2006 edition, in preparation for the International Polar Year (IPY, 2007–2008), carried a new set of questions from the National Science Foundation, intended to assess public knowledge and beliefs about polar regions.
An article about that survey, “Who cares about polar regions? Results from a survey of U.S. public opinion,” was published in 2008 in the journal Arctic, Antarctic, and Alpine Research. The article presents results from the first round of GSS polar questions, with statistical analysis and technical details. I’ll summarize a few of the findings here; write if you’d like a copy of the full article.
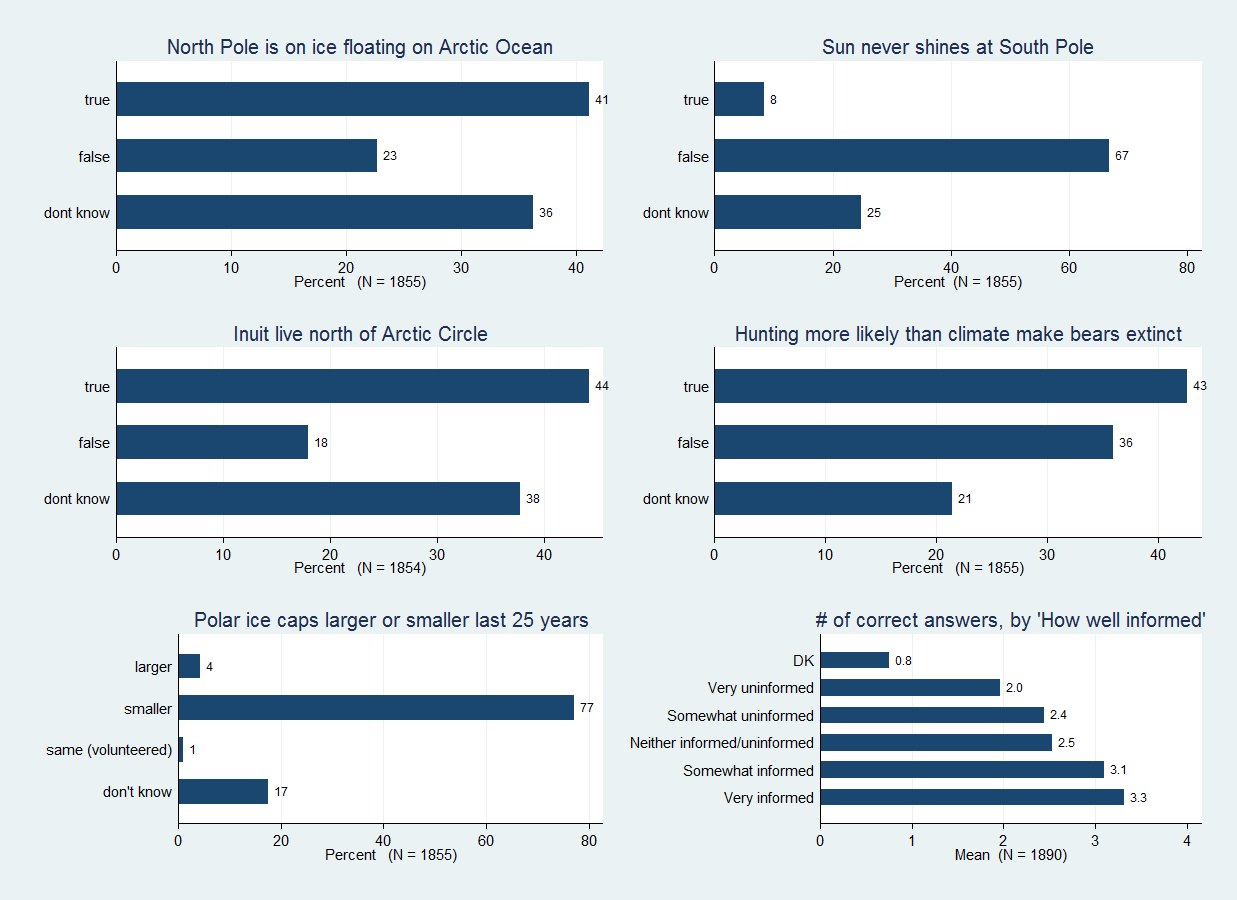
Five of the GSS questions were meant to assess polar knowledge. The first five bar charts in Figure 1 show how people answered; you can match your own guesses against theirs. We see, for example, that only 41 percent of the respondents know that the North Pole is on ice floating over the Arctic Ocean, although 67 percent know it is false that the sun never shines at the South Pole. Just 44 percent know it is true that Inuit (often called Eskimos) live north of the Arctic Circle. The sixth chart, at lower right in Figure 1, plots the average number of correct answers (0 to 5) against people’s self-assessment of how well informed they are about polar issues (“don’t know” or “very uninformed” to “very informed”). People who consider themselves “very informed” answered an average of 3.3 questions correctly; those “very uninformed” averaged just 2.
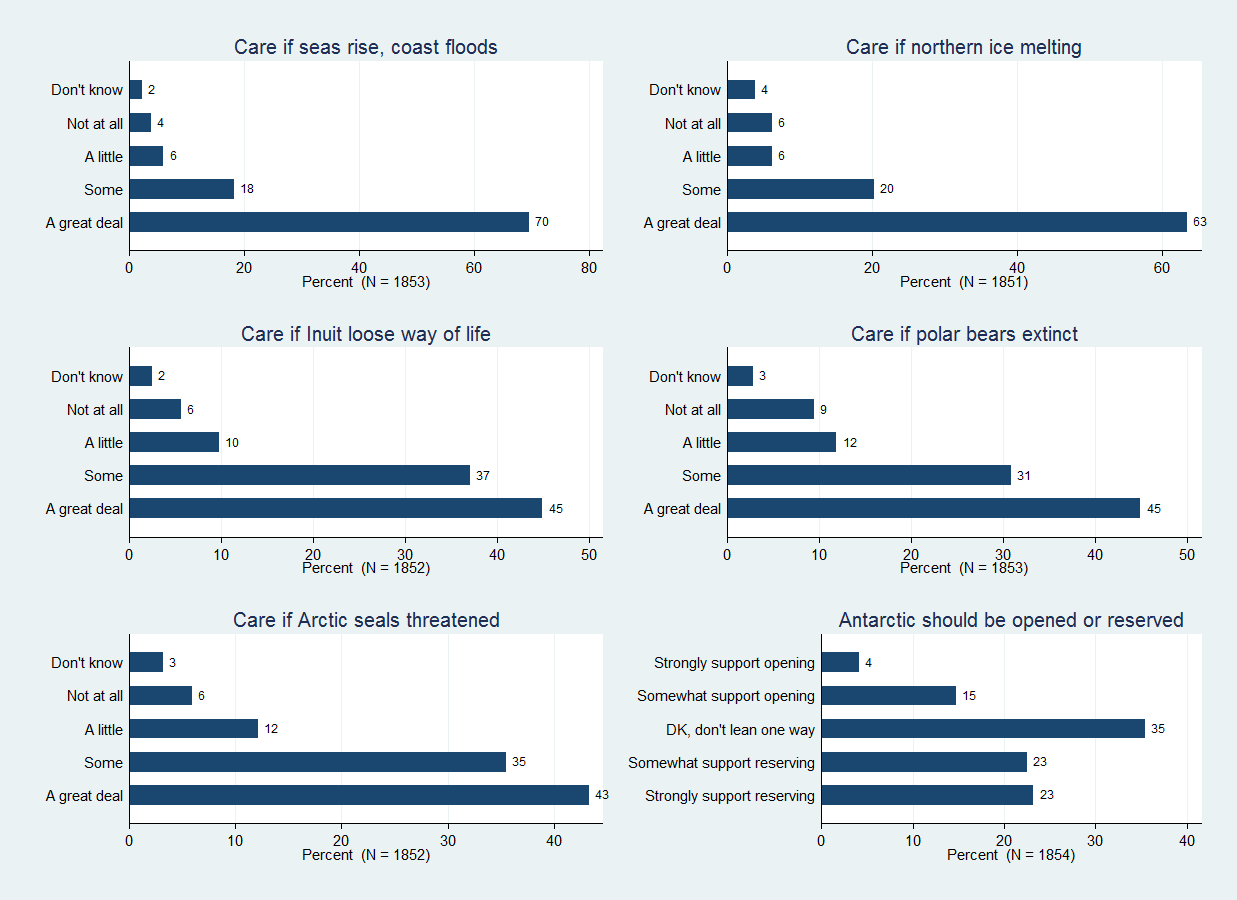
Other questions on the 2006 GSS sought opinions about possible polar effects of global warming. Figure 2 charts these results; again you can compare these with what you might answer. On the survey, 70 percent say they would be bothered a great deal, and only 4 percent not at all, if sea level rose 20 feet flooding coastal regions. The sixth chart at lower right in Figure 2 depicts opinions about whether the Antarctic should be reserved for scientific purposes, or opened for tourism, fisheries, oil and other commercial purposes. Forty-three percent somewhat or strongly support reserving Antarctica for science.
The “Who cares” paper also contains a statistical analysis of who holds these different opinions, and how opinions are related to polar knowledge along with background characteristics such as age, gender, income, education, political views and general science literacy (tested by a set of 11 other questions on the survey). Education, political views, polar knowledge and science literacy prove to be the most consistent predictors of polar opinions. For example, respondents with higher polar knowledge and science literacy scores express greater concern about melting ice caps, and about threats to polar bears or seals. Those with higher polar knowledge also are more inclined to favor reserving Antarctica for science.
The next installment of Polar Polling will compare the 2010 survey results, post-IPY, with the pre-IPY results from 2006. We will also look more closely at the connections to science literacy scores. Both the 2006 and 2010 GSS surveys asked a “first generation” of experimental polar knowledge and belief questions, not previously tested on large surveys. More specific questions building on that experience were then designed for newer surveys beginning in 2011. Future installments of Polar Polling will look at the newer surveys, some conducted within the past month and with results not yet published, to find out more about what people know, and who knows what, concerning the polar regions.
Polar Polling, Part Two
by Larry Hamilton
What do most people know, and what do they believe, about the polar regions? Who knows and believes what? This post marks the second installment of Polar Polling, a regular feature on the PoLAR Hub in which we look at survey research that explores public perceptions. This time we’ll start in the middle of the story, showing some interesting results before going back for more detail about the sources.
Science Literacy and Concern about Polar Change
Two nationwide U.S. surveys, conducted in 2006 and 2010, found that the more people know about polar regions, or the greater their science literacy is in general, the more likely they are to express concern about changing polar environments. The top left image in Figure 1 charts the percent of people on two nationwide surveys who say they would care “a great deal” if the northern ice cap melts. Among people who got no answers correct on a 5-question polar knowledge quiz, less than 30% care if the ice melts. This percentage rises steadily with the number of right answers, reaching more than 80% among those who answered all 5 questions correctly. The top right image in Figure 1 shows a similar pattern of rising concern as scores improve on an 11-point science literacy test. Just over 20% of those who answered no science questions correctly say they would care a great deal if the ice cap melts. This rises to more than 80% among those with the highest science literacy scores. Similar patterns in the two lower charts show that support for reserving the Antarctic for science also increases with higher polar knowledge and science literacy scores.
Figure 1
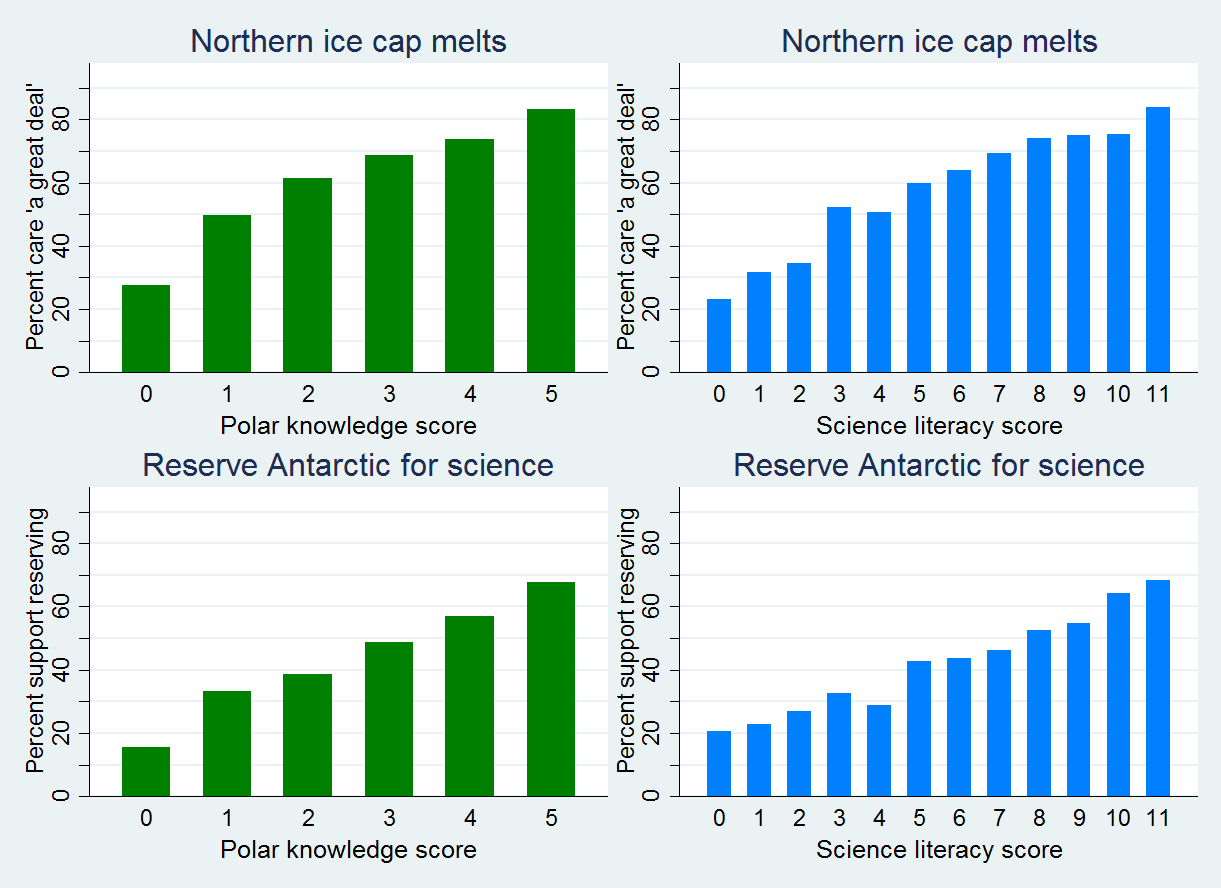
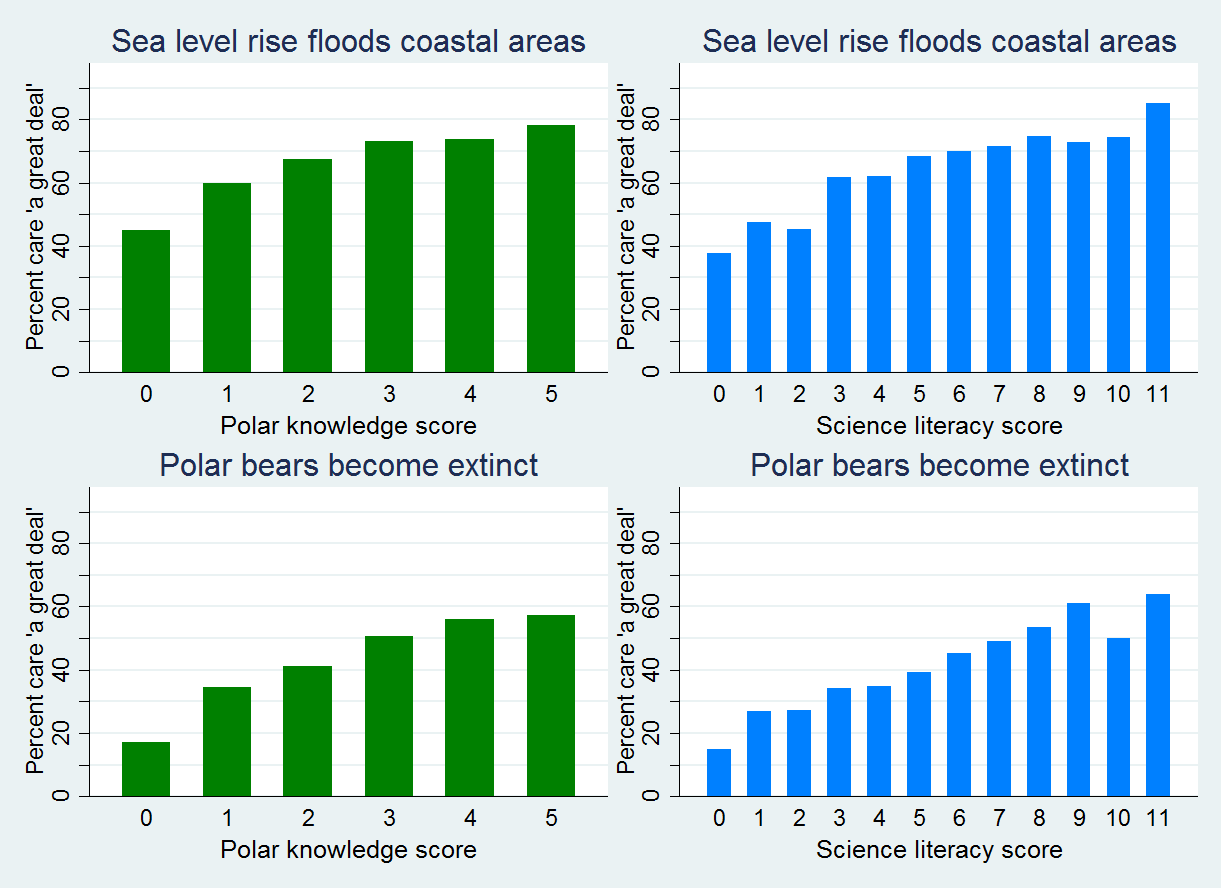
Figure 2 repeats this analysis for two other “concern” questions. The same general pattern appears: the percent who say they would care a great deal if sea level rise floods coastal areas, or if polar bears become extinct, increases with higher scores in both polar knowledge and general science literacy. These survey results highlight the key role that science literacy plays in public awareness about large-scale but seemingly distant environmental problems.
Figure 2
Background on These Surveys
The data behind Figures 1 and 2 are from the General Social Survey, which has been measuring U.S. public beliefs on a wide variety of topics since the 1970s. In 2006 and 2010, before and after the International Polar Year (2007–2008), the General Social Survey included a set of questions concerning the north and south polar regions. Some of these questions tested people’s knowledge of the polar regions, or of scientific facts in general. Other questions simply asked for opinions, such as how concerned people felt about polar aspects of climate change.
Question wording, background information, and further analysis of these polar surveys can be found in a brief published by the Carsey Institute (now the Carsey School of Public Policy) at the University of New Hampshire: “Public knowledge about polar regions increases while concerns remain unchanged” (2012). As the title notes, detailed comparison of the 2006 and 2010 surveys suggests that public knowledge of the polar regions had significantly improved, but concern about polar aspects of global change (such as melting ice, endangered species) remained divided along political lines, with little overall movement. Likewise, public support for reserving the Antarctic for science (rather than opening it for commercial development) stayed about the same.
Two research articles take a more technical look at the surveys, testing the influence of people’s individual background and beliefs on polar perceptions, along with a number of different measures of science education or knowledge:
“Who cares about polar regions” in Arctic, Antarctic, and Alpine Research (2008);
“Public knowledge and concern about polar region warming” in Polar Geography (2012).
What’s Ahead
The General Social Survey questions from 2006 and 2010 represent a first generation of polar polling. In our next installment we’ll turn to the second generation of polls, which asked more specific questions aimed at growing public awareness.
Polar Polling, Part Three
by Larry Hamilton
What do most people know, and what do they believe, about the polar regions? Who knows and believes what? This post marks the third installment of Polar Polling, a regular feature on the PoLAR Hub in which we look at survey research that explores public perceptions.
Two Survey Questions About Polar Ice
The first two installments focused on questions carried by the US General Social Survey (GSS) in 2006 and then again in 2010. These surveys have been analyzed in a publicly accessible report:
“Public knowledge about polar regions increases while concerns remain unchanged” Carsey School (2012);
and also in two journal articles:
“Who cares about polar regions” in Arctic, Antarctic, and Alpine Research (2008);
“Public knowledge and concern about polar region warming” in Polar Geography (2012).
Some of the GSS questions sought to test people’s knowledge about the polar regions. One asked about ice:
Would you say the polar ice caps have gotten larger or smaller over the last 25 years?
On the more recent (2010) GSS, 81 percent of respondents answered “smaller,” which was meant to be the right answer. Someone knowledgeable about polar regions could point out, however, that the question is ambiguous. By “polar ice caps” the survey designers meant sea ice, but did not say this explicitly. Both the north and south polar regions contain huge ice sheets on land (Greenland and Antarctica, respectively) which have very different physical properties than sea ice. Sea ice is mainly frozen sea water. It is a few feet or yards thick, floating on the ocean. Land ice is mainly formed from compressed snow. It can be more than a mile thick, mostly resting on land. Sea ice area expands by millions of square kilometers each winter and then melts again by a similar amount each summer. Land ice exhibits some seasonal melting but its area changes much more slowly. Moreover, while Greenland and West Antarctic land ice have been losing mass in recent years, East Antarctic land ice has been closer to stable. And while Arctic sea ice area (especially in late summer) has declined, Antarctic sea ice area has recently increased. Thus, the “polar ice caps” question wording could lead into a complicated discussion with various answers, some of them still under research.
As both scientific and public discussion about climate change became more nuanced in the years since the original GSS questions were written (2005), there is a need for more detailed questions. On a 2011 national survey (NCERA) carried out by researchers at the Carsey School of Public Policy, we asked:
Which of the following three statements do you think is more accurate? Over the past few years, the ice on the Arctic Ocean in late summer …
- Covers less area than it did 30 years ago
- Declined but then recovered to about the same area it had 30 years ago
- Covers more area than it did 30 years ago
- Don’t know/no answer
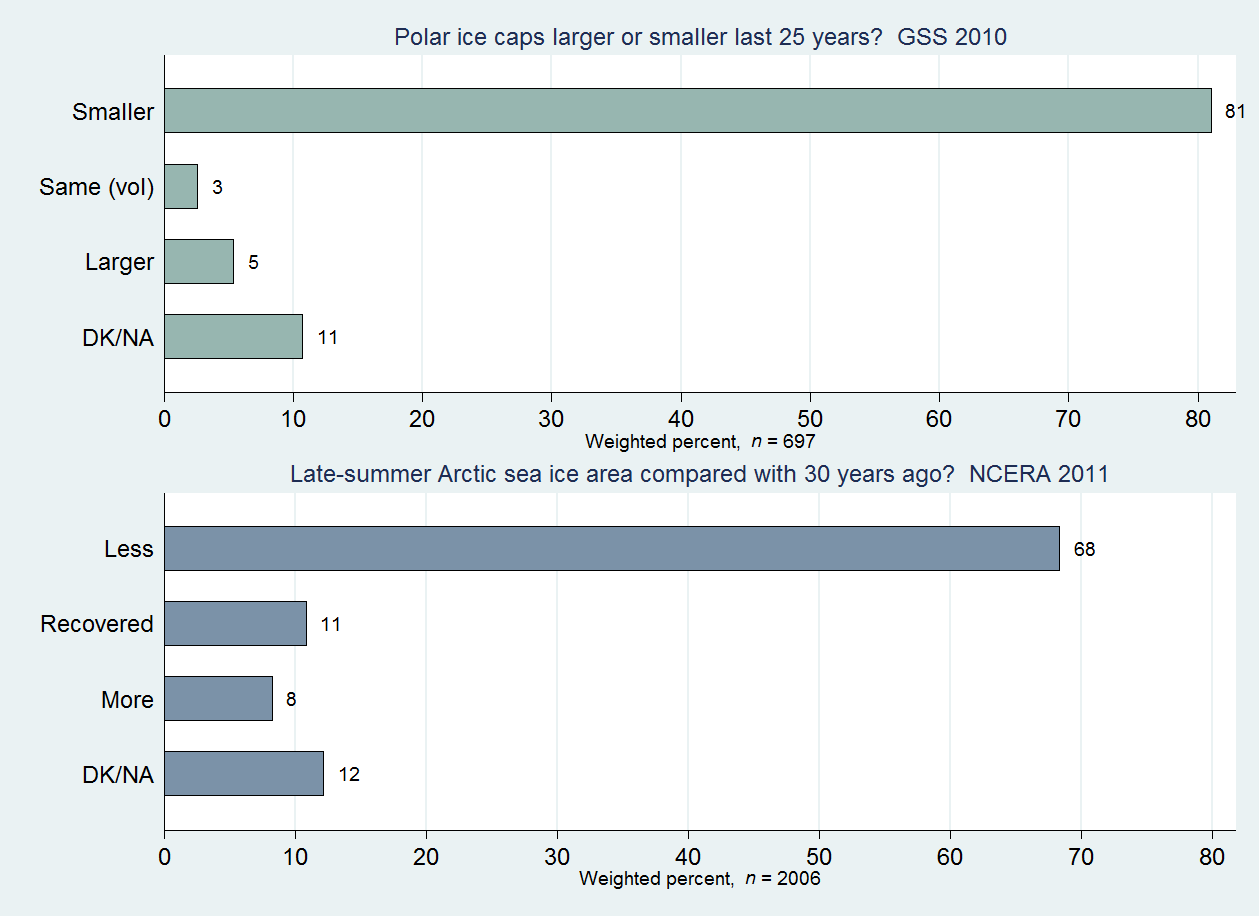
This question avoids ambiguity by specifying sea ice (not land ice), its location (Arctic), the measure of comparison (area), the season (late summer), and the time frame (past few years compared with 30 years ago). Sixty-eight percent of the NCERA respondents chose “covers less area,” which in this case unambiguously is correct. Figure 1 shows the GSS (2010) and NCERA (2011) results together, although their differences in wording mean we cannot compare these directly. The more detailed NCERA question, for instance, differs from GSS in having a reasonable-sounding middle option “declined but then recovered,” which drew 11 percent. The uncommon “same” response for GSS was not part of the question, but volunteered by some respondents.
Figure 1
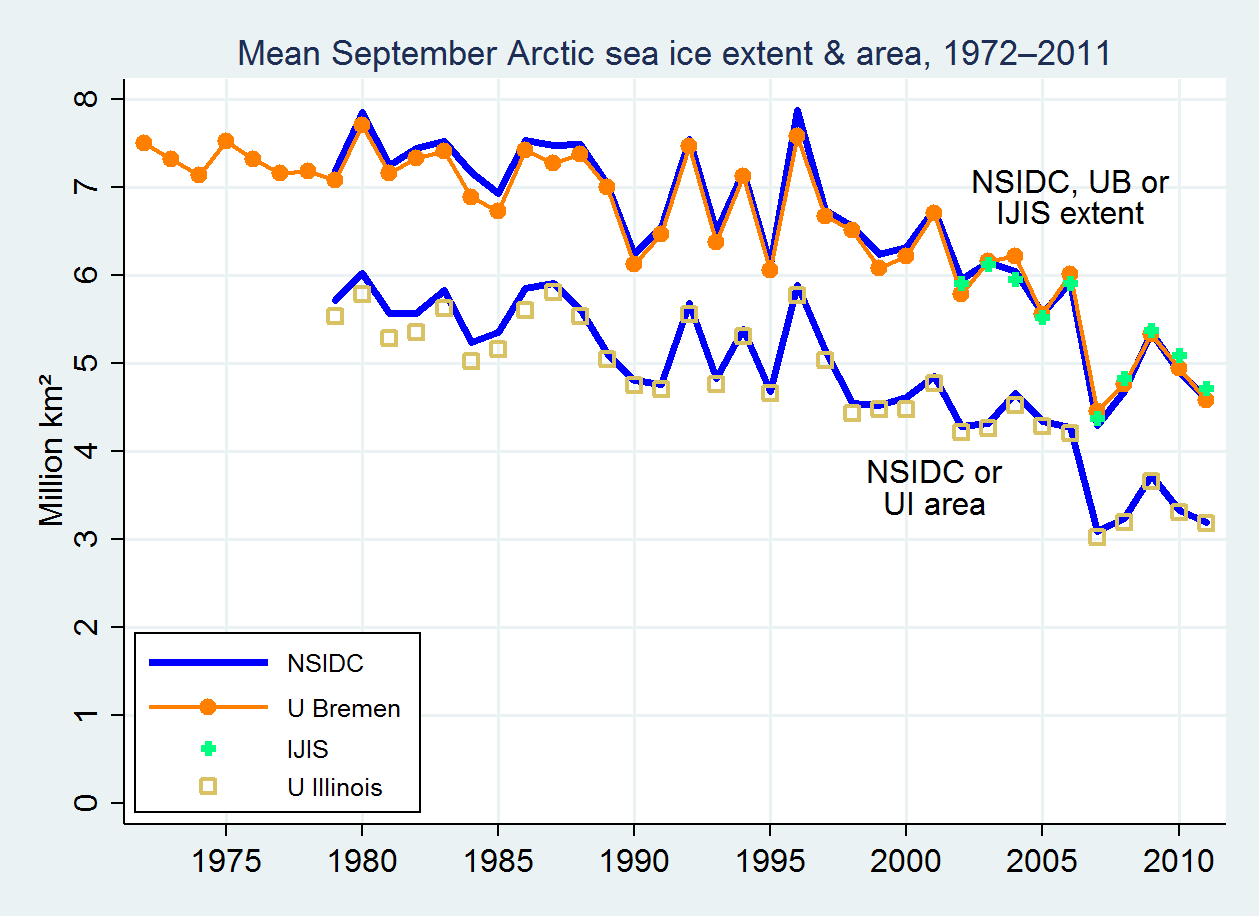
Change in Real Arctic Sea Ice
How do we know that “less area” is correct? Arctic sea ice area and extent (two different but related measures) have been observed by satellites since the 1970s. Figure 2 graphs September Arctic sea ice area or extent as calculated by several different research groups. Arctic sea ice area in September of recent years (as of the 2011 NCERA survey) had been fluctuating about two million square kilometers below the areas measured thirty years before.
Figure 2
So two-thirds of the NCERA respondents got this sea-ice question right. From an Arctic scientist’s point of view that level of public awareness seems encouraging. But we will see that, as with ice itself, these survey results are more complicated than they appear.
Demographics and Sea Ice Perceptions
From a social scientist’s point of view, results like Figure 1 are just a first step. The next step, often more interesting, is to find out who responded in each way. Survey answers across a wide range of questions often show differences by demographic characteristics such as age, gender, or education; and also by questions about people’s worldview or more general beliefs. Figure 3 shows the percentage of correct “less ice” responses on NCERA broken down by age, gender, education and what people personally believe about climate change, based on this question:
Which of the following three statements do you personally believe?
- Climate change is happening now, caused mainly by human activities.
- Climate change is happening now, but caused mainly by natural forces.
- Climate change is NOT happening now.
- Don’t know/no answer
Figure 3
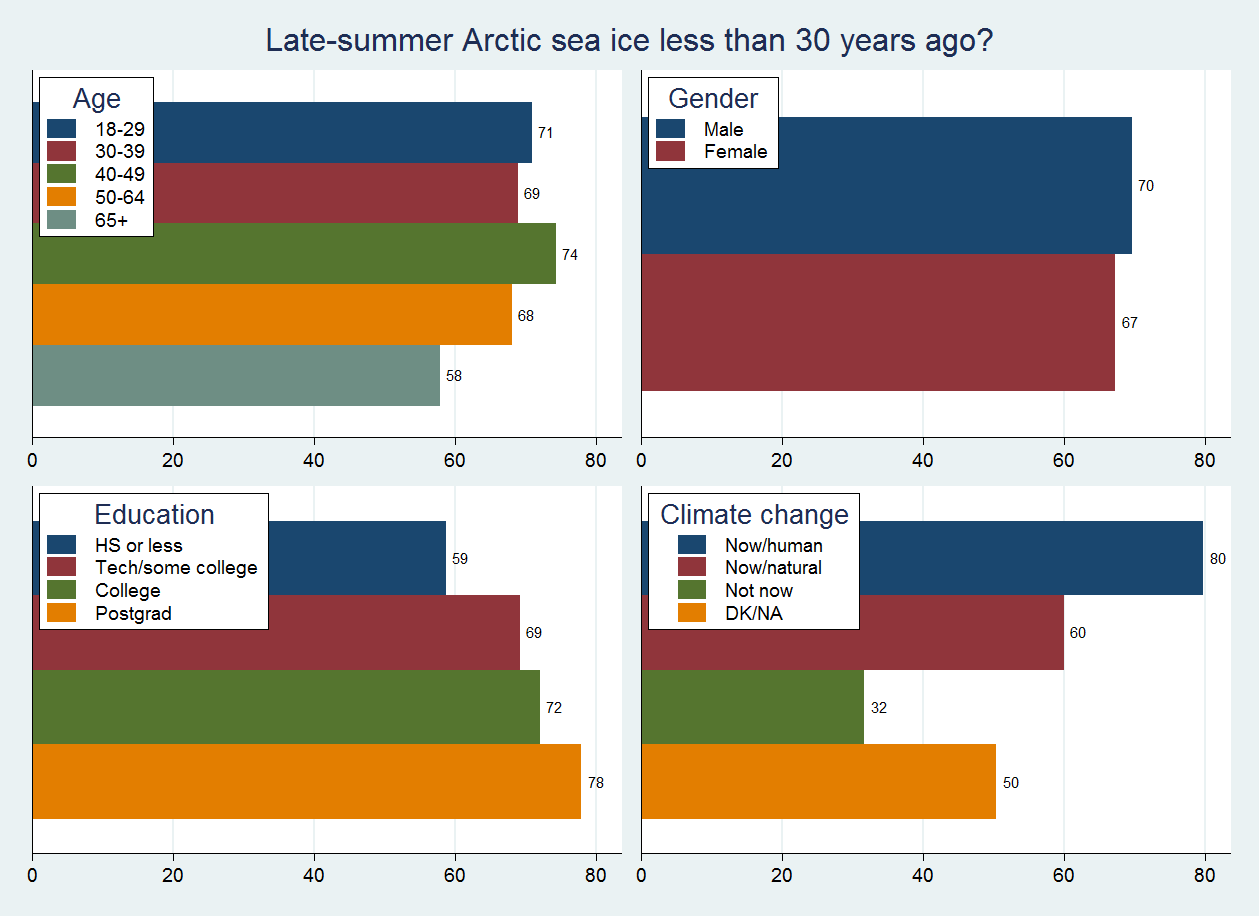
The small gap between males and females (70 vs. 67 percent) in sea-ice perceptions is not statistically significant, but other differences in Figure 3 are. Older respondents are less likely to know that Arctic sea ice area has decreased; respondents with college or postgraduate education are more likely. People who believe that climate change is happening now, caused mainly by human activities, very often (80 percent) say that ice has decreased. Those who agree that climate change is happening, but mainly for natural reasons, are less inclined (60 percent) to know or guess correctly that Arctic sea ice area decreased. And those who don’t believe that climate change is happening also don’t believe (32 percent) that Arctic ice has decreased. The pattern of results likely reflects not just differences in knowledge, but also a tendency for people to guess or form convictions about a specific physical reality (area of Arctic sea ice) based on their broader worldview or beliefs.
The NCERA survey included several non-polar but climate-related questions as well. Some of these (such as whether CO2 in the atmosphere is increasing) show both education and belief effects like those in Figure 3, while others (such as whether sea ice or land ice has more potential to raise sea level) relate to respondent education only — perhaps because worldview or beliefs give no clues about how to answer that question. A more detailed look at these results appears in “Did the Arctic ice recover? Demographics of true and false climate facts” in Weather, Climate, and Society (2012).
What’s Ahead
In 2011 the nationwide NCERA survey tested this new sea ice question nationally. At the same time, we started placing the same question on statewide surveys in New Hampshire, which could be repeated from time to time watching for signs of change as different news came in about sea ice. We also began to experiment with other polar questions, such as asking whether people believe that Arctic warming might affect the weather where they live. The next installment of Polar Polling will explore those results.